AI-Powered Hydrocarbon Optimization

Intelligent Production & Energy Optimization for Hydrocarbon Assets

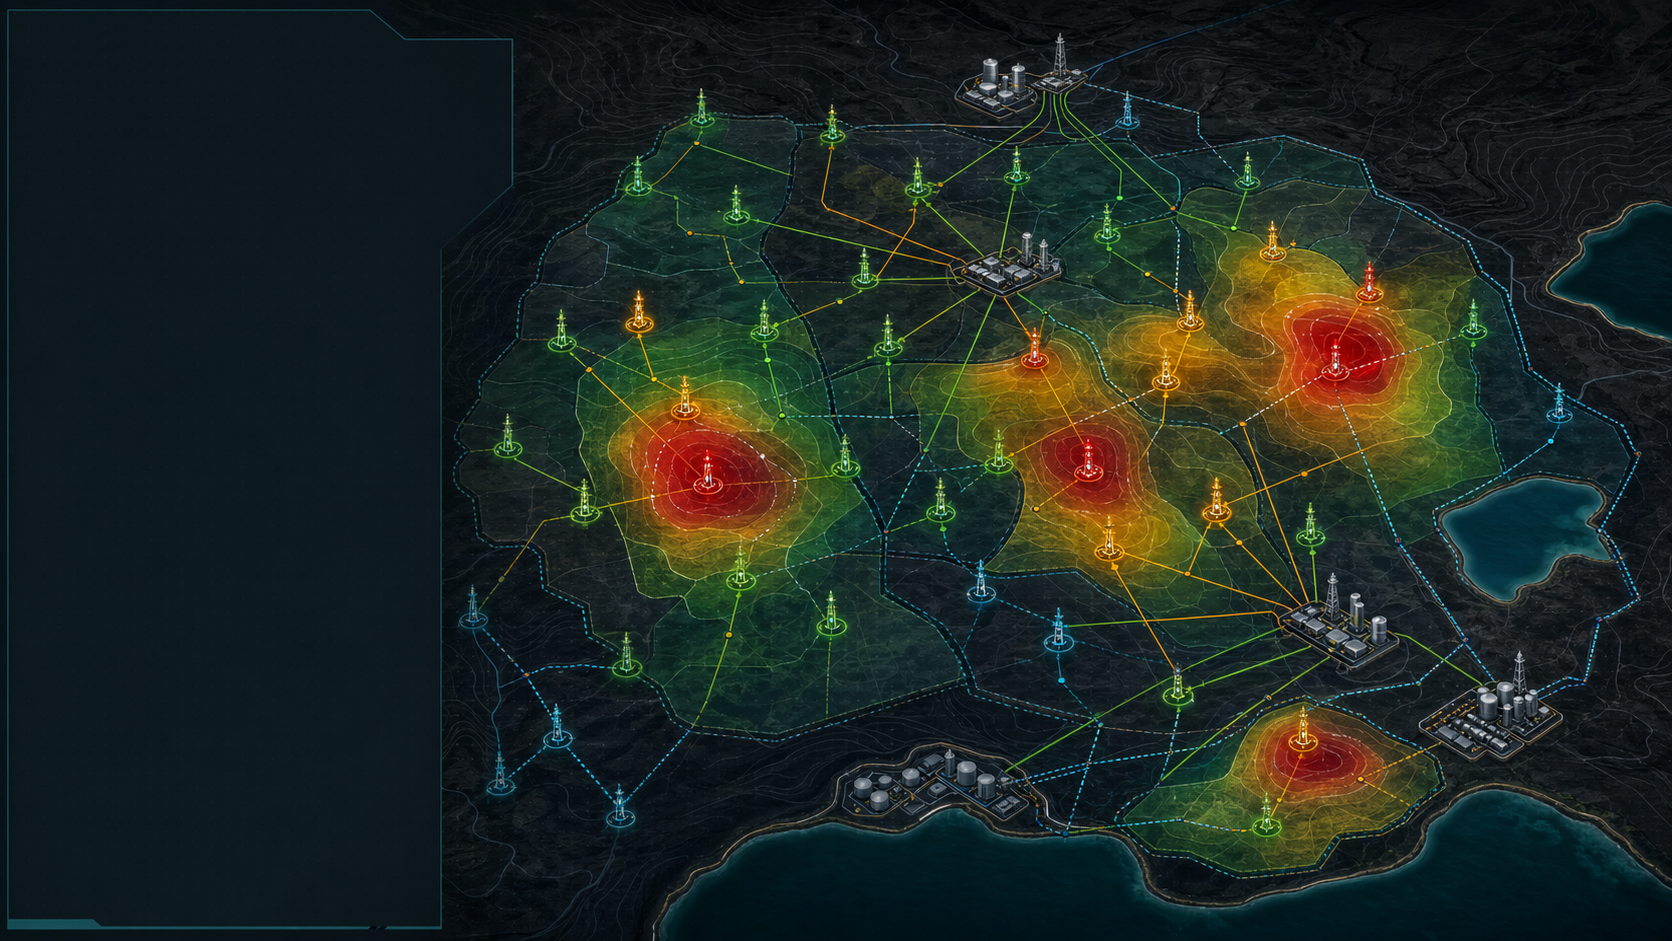
We transform operational, thermodynamic, and reservoir data into actionable causal decisions that improve production, recovery, and energy efficiency.

8-20%
Pilot Production Uplift Potential
0-1
Process Energy Index Standard
5
Integrated Decision Modules
Dashboard
All licensed ⌵ Production ⌵ Area selection ⌵
Field wellhead mapping Active Grid
52.4°N SEC-04
Real-time production analytics
AprMayJun
Production Uplift +18.4% Net
Quant Operating Impact

Data + Physics + Machine Learning

Models that reflect field behavior instead of relying only on correlations.

Weeks, Not Months

Focused diagnostics designed to move quickly from data review to action ranking.

Scenario Decisions

Compare production, energy, injection, and artificial lift alternatives before CAPEX is committed.

The Problem

Production assets generate data, but not always actionable decisions.

01

Limited System Visibility

Operational, energy, reservoir, and infrastructure signals often remain separated across teams and tools.
02

Correlation-Driven Decisions

Field decisions can depend on isolated experience or statistical coincidence instead of process causality.

03

Deferred Production

Restrictions in wells, patterns, injection, and artificial lift systems are hard to prioritize early.

04

Energy Without Traceability

High energy consumption is visible, but the process-level source of efficiency loss is not always clear.

Our Philosophy

Causality, not coincidence.

Quant combines engineering, data science, energy analysis, and predictive modeling to identify not only what is happening, but why it is happening and which actions can create the greatest impact.

Input Asset Data
Engine Causal Model
Output Prioritized Action
Operating Architecture

Perceive. Reason. Act. Learn.

A field-applicable operating loop that connects measured variables, physics-based reasoning, and continuous feedback.

Step 01

Perceive

Integrate production, pressure, energy, artificial lift, injection, fluid quality, and operational data.

Step 02

Reason

Build causal and physics-based models instead of relying only on statistical correlations.

Step 03

Act

Recommend operating adjustments for production, injection, energy consumption, or system restrictions.

Step 04

Learn

Update the strategy with new operational information, validation, and field feedback.

Conventional Optimization
Energy Efficiency Intelligence
Artificial Lift Monitoring
Technology Suite

Five Integrated Solution Modules

Modular decision support engineered for well, pattern, facility, and portfolio-scale optimization.

AI

1. Production Optimization AI

Optimization at well, pattern, and field scale.

Active Optimization
  • Production analytics
  • System Exergy optimization
View Details →
EX

2. Energy Efficiency & Exergy Analytics

Energy analysis, efficiency losses, exergy, and process-level performance.

Continuous Optimizing
  • Process exergy tracking
  • Loss quantification
View Details →
ALS

3. Intelligent ALS Monitoring

Detection of failures, restrictions, and improvement opportunities in artificial lift systems.

Active Dynamic Control
  • Dynamic artificial lift control
  • Downhole restriction avoidance
View Details →
RS

4. Reservoir & Pattern Intelligence

Producer-injector interference, recovery behavior, and neighboring pattern signals.

Continuous Monitoring
  • Inter-well interference mapping
  • Pattern sweep balancing
View Details →
DV

5. Development Strategy Engine

Decision support for infill wells, expansion, reserves optimization, and targeted CAPEX.

Strategic Planning
  • Infill well prioritization
  • Reserves recovery forecasting
View Details →
Quant Energy Intelligence

Process-Level Energy Efficiency Index (0.00 – 1.00)

Quant uses a 0-1 process index to compare energy efficiency across pre-injection, injection, and production stages.

Process Energy Efficiency Index 68% EFFICIENCY
0.00 0.25 0.40 0.68 0.85 1.00
STAGE 01

Pre-Injection

Water treatment, chemicals & transport

850 GJ
Optimal Flow
STAGE 02

Wellhead Injection

Injection systems, valves & pressure

350 GJ
Peak Performance
STAGE 03

Field Production

Produced fluids & artificial lift response

250 GJ
Current Stage
Current Index Score
0.68

Energy performance is constrained by process-level losses that require targeted validation.

Primary, secondary, and tertiary recovery diagram
Multivariable Signal Analysis

Energy Reveals the Field Story

The platform converts dense operating data into decision-ready maps, restriction indicators, and prioritized improvement opportunities.

Quant Live Operating Model
Variables in motion
Oil Production
Produced Water
Specific Energy
ALS Motor Frequency
Dominant Restriction

Artificial lift energy drift

Electrical and mechanical losses detected in artificial lift pump envelopes.

Recommended Action

Prioritize high-impact operating window

Re-calibrate intake chokes and motor frequencies to arrest energy slip.

Request Technical Diagnostic
Applications

Operational decision support for asset performance.

Primary and secondary production optimization
EOR feasibility segmentation
Water and tertiary fluid injection evaluation
Injector-producer pattern optimization
Well interference identification
Near-field opportunity prioritization
Infill well planning
Deferred production reduction
Reserves optimization
Energy efficiency optimization
Dominant restriction identification
Artificial lift monitoring

Improved Predictive Capability

Anticipate operating behavior and converge faster toward the optimal operating point.

Lower Deferred Production

Identify restrictions before they become persistent production losses.

Targeted Capital Allocation

Prioritize investments based on dominant restrictions and expected operational impact.

Improved Energy Efficiency

Trace energy losses by process and compare scenarios through Quant's efficiency index.

Validation Note: Potential production increases in pilots between 8% and 20% are subject to asset-level validation.
Implementation Workflow

A practical path from diagnosis to continuous improvement.

Phase 1

Asset Diagnosis

Review available data, production architecture, critical variables, and operational objectives.

Phase 2

Data Integration

Organize production, energy, injection, pressure, artificial lift, reservoir, and operational data.

Phase 3

Causal & Energy Modeling

Develop models based on physics, causality, energy efficiency, and predictive analytics.

Phase 4

Operational Recommendations

Identify prioritized actions to improve production, efficiency, reliability, or recovery.

Phase 5

Validation & Improvement

Monitor impact, incorporate field feedback, and progressively adjust the model.

Let's uncover the story behind your data.

Start with a focused asset review to assess data readiness, identify dominant restrictions, evaluate energy-efficiency opportunities, and prioritize the highest-value operating scenarios.

Direct Communication info@quant-ips.com
Engineering Desk +1 307 256 0454
Asset Deployment Onshore, Offshore & Deepwater Assets
Confidentiality Commitment: All operational telemetry, well records, and reservoir data are evaluated strictly under mutual Non-Disclosure Agreement (NDA).

Enterprise Technical Assessment Request

Submit your field parameters to review deployment feasibility.